Hexagons!

Digression: The Analogy of the “Fine Chancery Hand”
This is surely a digression, but I happened to look at Brad DeLong’s economic growth course slides, and he makes the analogy of data science to the chancery hand. But before chancery hand was italic handwriting, the hand of the Vatican scribes.
Which you may learn by (somehow) obtaining John Le F. Dumpleton’s book on handwriting, an italic flat-nibbed pen, and practicing up.
Digression ][ Italic
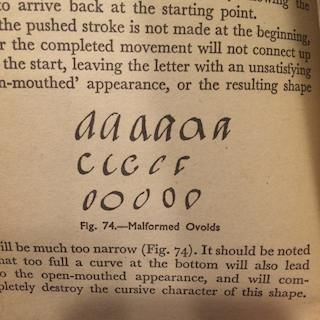
By dint of making very many malformed ovoids (see illustration from book below) you will be able to make them more quickly and perfectly than ever before.

So, getting back to data science.
Here’s an H5 map of housing unit density


— all photos Copyright © 2022-2024 George D Girton all rights reserved
